


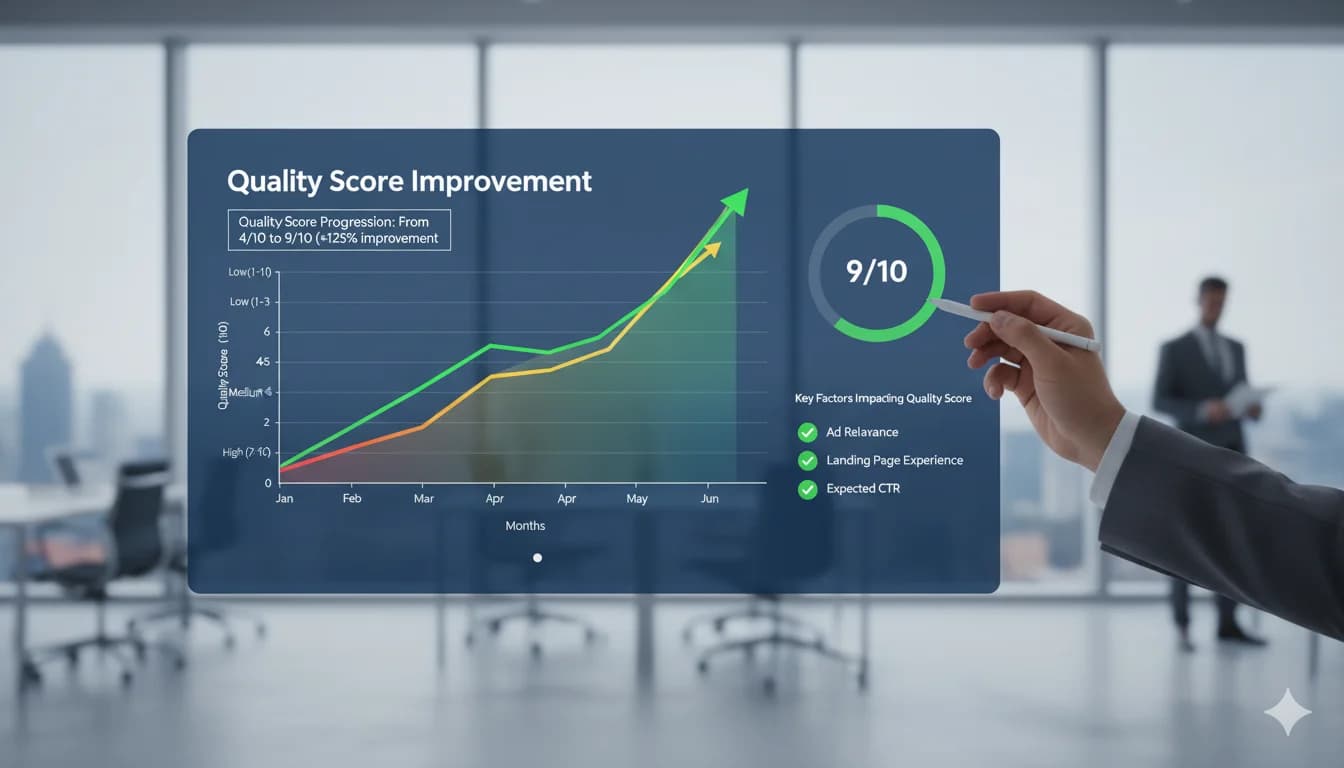
Reality: From my practice, the ad quality that Quality Score reflects is one of the most important cost levers in Google Ads. In the fictional worked example below, you pay significantly less per click at QS 9/10 than at QS 5/10. This guide shows how to go from 3/10 to 9/10.
What is Quality Score?
Definition: Google's rating of your keywords, ads, and landing pages' relevance (scale 1-10)
Why important?
Ad Rank: There is no simple formula of bid times Quality Score. According to Google's help article on Ad Rank, Ad Rank is based on six factors at a high level:
- Your bid
- The quality of your ads and landing page (Quality Score summarizes Google's assessment of it)
- The Ad Rank thresholds (minimum values an ad has to reach to show)
- The competitiveness of the auction
- The context of the search (search terms, location, device, time and other signals)
- The expected impact of assets and other ad formats
Google says Quality Score itself is not an input in the ad auction but a diagnostic tool (Google's help article on Quality Score). It shows you how your ad quality compares to other advertisers. Because that quality feeds into Ad Rank, a better ad can win against a higher bid.
CPC impact (fictional worked example for illustration, not a Google formula):
Quality Score 5/10: CPC €2.00
Quality Score 7/10: CPC €1.40 (-30%!)
Quality Score 9/10: CPC €1.00 (-50%!)
With €10,000/month budget:
- QS 5/10: 5,000 clicks
- QS 9/10: 10,000 clicks (+100%!)
- In the worked example: same budget, twice the clicks. How strong the effect is in your account depends on competition and the auction.
The 3 Quality Score Components
1. Expected CTR (Click-Through Rate)
- How likely is a user to click your ad?
- Based on historical performance
2. Ad Relevance
- How well does your ad match the search term?
- Is keyword present in ad?
3. Landing Page Experience
- Is landing page relevant?
- Good load time?
- Mobile-friendly?
- Good content?
Weighting: Google does not publish an official weighting of the three components. What matters is which of them your account rates as "Below average": that is where your lever is.
Ratings per component:
- "Above average" ✅ (goal!)
- "Average" 😐
- "Below average" ❌ (problem!)
Check Quality Score
Where to find?
Google Ads → Campaigns → Keywords (tab)
→ Modify columns → Quality Score → Add:
  - Quality Score
  - Quality Score (hist.)
  - Expected CTR
  - Ad Relevance
  - Landing Page Experience
Interpretation:
QS 8-10: ✅ Excellent (typically lower CPCs)
QS 6-7: 😐 Ok (average CPCs)
QS 4-5: ⚠️ Needs improvement (typically higher CPCs)
QS 1-3: ❌ Critical (often very high CPCs, pause!)
How Quality Score is distributed across your whole account is one of the points I evaluate in the Google Ads audit.
The 12 Strategies for QS Improvement
Strategy 1: Improve Keyword-Ad Match
Problem: Keyword "men's running shoes" → ad about "sports shoes in general"
❌ Poor relevance:
Keyword: "nike men's running shoes"
Ad:
  Buy Sports Shoes Cheap
  Large selection of sports shoes
  Order online now
→ Ad Relevance: Below average
✅ Good relevance:
Keyword: "nike men's running shoes"
Ad:
  Nike Men's Running Shoes | Sale
  Premium running shoes by Nike
  Free shipping over €50
→ Ad Relevance: Above average
Best practice: Keyword in ad text min. 2x (headline + description)
Dynamic Keyword Insertion (DKI):
Ad:
  Headline: "Buy {KeyWord:Running Shoes} Cheap"

User searches "nike running shoes" → Ad: "Buy Nike Running Shoes Cheap"
User searches "adidas running shoes" → Ad: "Buy Adidas Running Shoes Cheap"
Setup:
{KeyWord:Fallback Text}
- Keyword = Capitalizes Each Word
- keyword = lowercase
- KEYWORD = UPPERCASE
Caution: Don't use with Broad Match (inappropriate insertions!)
Strategy 2: Tightly Themed Ad Groups (Instead of SKAGs)
Problem: 50 keywords in one ad group = no relevance
A note on SKAGs: The once popular SKAG method (Single Keyword Ad Groups, just one keyword per ad group) is only of historical interest today. Since exact match also covers close variants and Smart Bidding and responsive search ads benefit from pooled data, SKAGs tend to fragment the account. What remains is the idea behind them: tightly themed ad groups.
Bad example:
Ad Group: "Shoes"
Keywords:
- running shoes
- sneakers
- trainers
- sports shoes
- athletic shoes
- ... (50 more)

Ad (generic):
  Buy Shoes Online
  → Doesn't fit any keyword really well!
Tightly themed structure:
Ad Group 1: "Nike Men's Running Shoes"
Keywords (3-5 closely related):
- [nike men's running shoes] (Exact)
- "nike men's running shoes" (Phrase)
- "nike running shoes for men" (Phrase)

Ad:
  Nike Men's Running Shoes | Sale
  → High relevance!
Advantages:
- Higher ad relevance
- Higher CTR (more relevant ads)
- Better landing page match
- In my experience a higher Quality Score than with a catch-all ad group
Effort: More ad groups than a catch-all, but far fewer than with SKAGs. Worth it!
Strategy 3: Use Negative Keywords Aggressively
Problem: Irrelevant clicks = low CTR = poor QS
Example:
Keyword: "men's running shoes" (Broad Match)
Also triggers:
- "men's running shoes used" (you don't sell)
- "men's running shoes review" (info search, no purchase)
- "men's running shoes repair" (service, no sale)
→ User doesn't click → CTR drops → QS drops
Solution: Add negative keywords!
Typical negative keywords:
- "free", "gratis"
- "used", "second hand"
- "repair", "fix"
- "guide", "tutorial"
- "review", "test", "rating" (expensive + low purchase intent)
- "diy", "make your own"
- "rent", "lease"
- "salary", "wage" (job seekers)
Setup:
Google Ads → Campaign → Keywords → Negative Keywords
→ Add at campaign level
Weekly review:
Google Ads → Campaign → Search Terms
→ Add irrelevant terms as negative
Strategy 4: Increase CTR Through Better Ads
Expected CTR is one of the three QS components, and you influence it directly through your ads!
Ad best practices:
1. Use numbers & percentages:
❌ "Large selection"
✅ "Over 500 models"

❌ "Discount available"
✅ "Up to -40% sale"
2. Use call-to-action:
❌ "Running shoes available"
✅ "Get running shoes now"

Other CTAs:
- "Order now"
- "Secure sale"
- "Try free"
- "Get quote"
3. Highlight USPs:
- "Free shipping over €50"
- "30-day return policy"
- "24h express shipping available"
- "★★★★★ 4.8/5 (1,234 reviews)"
4. Create urgency:
- "Today only: -40%"
- "Limited quantity"
- "Last day: Free shipping"
5. Use all relevant assets (formerly ad extensions):
- Sitelink assets (4x)
- Callout assets (4x)
- Structured snippet assets (2x)
- Call assets
- Location assets (local)
- Price assets
- Seller ratings (appear automatically)
Result: In my experience CTR goes up, and over time the "Expected CTR" rating in your Quality Score improves as well.
Strategy 5: Maximize Landing Page Relevance
Problem: Ad about "Nike Men's Running Shoes" → Landing Page = Homepage (generic)
❌ Poor landing page:
Keyword/Ad: "Nike Men's Running Shoes Size 42"
Landing Page: Homepage (all products)
→ User must search
→ High bounce rate
→ Poor landing page experience
✅ Good landing page:
Keyword/Ad: "Nike Men's Running Shoes Size 42"
Landing Page: /nike-running-shoes-men?size=42
→ Directly relevant products (filtered!)
→ User finds what they need immediately
→ Excellent landing page experience
Best practices:
1. Mention keyword on landing page:
<h1>Nike Men's Running Shoes</h1>
Text: "Our Nike running shoes for men offer..."
→ Google sees relevance!
2. Above-the-fold content:
- Main product/offer immediately visible
- No long scrolling required
- CTA above-the-fold
3. Dedicated landing pages:
- Own LP per ad group
- Not: Everything to homepage
Example structure:
Ad Group: "Nike Men's Running Shoes"
→ Landing Page: /nike-running-shoes-men

Ad Group: "Adidas Men's Running Shoes"
→ Landing Page: /adidas-running-shoes-men
Strategy 6: Optimize Page Speed
Why it matters: Google explicitly names faster loading as a lever for a better landing page experience. On top of that, from my practice every extra second of load time tends to drag down conversions noticeably.
Test:
Google PageSpeed Insights → Enter URL
Orientation from my practice (Google does not publish fixed thresholds):
0-2 seconds: ✅ Excellent
2-3 seconds: 😐 Ok
3-5 seconds: ⚠️ Slow
5+ seconds: ❌ Critical (Quality Score suffers!)
Quick fixes:
1. Compress images:
Tool: TinyPNG.com
Before: 5 MB → After: 500 KB
→ 90% smaller, minimal quality loss
2. Enable browser caching:
# .htaccess (Apache)
<IfModule mod_expires.c>
  ExpiresActive On
  ExpiresByType image/jpg "access plus 1 year"
  ExpiresByType image/jpeg "access plus 1 year"
  ExpiresByType image/png "access plus 1 year"
  ExpiresByType text/css "access plus 1 month"
  ExpiresByType application/javascript "access plus 1 month"
</IfModule>
3. Use CDN:
Cloudflare (free)
→ Static files (images, CSS, JS) from edge servers
→ in my experience noticeably faster load times
4. Lazy loading:
<img src="image.jpg" loading="lazy" />
→ Images only load when visible
5. Minify CSS/JS:
Tools: Autoptimize (WordPress Plugin)
→ Removes whitespace, compresses code
Goal: < 2 seconds load time (rule of thumb from my practice, an "Above average" landing page experience also depends on relevance and content)
Strategy 7: Optimize Mobile Landing Pages
Today the majority of Google searches happen on mobile!
Mobile checklist:
1. Responsive design ✅:
- No horizontal scrolling
- Text readable without zoom (min. 16px)
- Buttons large enough (min. 48x48px)
2. Mobile page speed ✅:
Goal: < 2 seconds on 3G
Test: PageSpeed Insights (Mobile tab)
3. Click-to-call ✅:
<a href="tel:+491234567890">
  Call now: 0123-456789
</a>
→ One tap = call
4. Minimized forms ✅:
❌ 12 fields (name, address, etc.)
✅ 3 fields (name, email, phone)
5. No Flash, no intrusive pop-ups ✅:
- Flash = not supported
- Intrusive pop-ups and interstitials annoy users, especially on mobile
  (Google documents them as an organic Search topic,
  it does not name a separate Ads penalty for them)
Test:
Lighthouse (Chrome DevTools) or PageSpeed Insights
→ Enter URL, check the mobile view
(Google retired its Mobile-Friendly Test in December 2023)
Strategy 8: Use Historical Performance
How history counts: According to Google, Quality Score is based on past impressions for exact searches of your keyword. Google also states that moving an ad group with the same ads and keywords to another campaign or account doesn't impact your ad quality.
What that means: The common belief that deleting and re-adding resets QS to a starting value is not found in Google's documentation. What really gets re-evaluated is what changes in substance: new keywords, new ad copy, new landing pages. That's why it pays not to rebuild well-performing keywords and ads without a reason.
Best practice:
- Still prefer pausing old keywords and ads over deleting: the statistics stay on the element and you can reactivate at any time
- For ad changes: New ad in parallel, pause the old one only after 2-4 weeks
A/B testing correctly:
Step 1: Add new ad (parallel to old)
Step 2: Run 2-4 weeks
Step 3: Pause the worse one
→ The comparison stays traceable in the account
Strategy 9: Use Match Types Cleverly
Problem: Broad Match = many irrelevant clicks = low CTR = poor QS
Match types by control:
Broad Match (wide):
Keyword: running shoes
Triggers: "best running shoes", "where to buy sneakers", "shoe store near me"
→ Least control
→ Lowest CTR
→ Worst QS
Broad Match Modifier (+), no longer available:
Google retired the old modifier (e.g. +running +shoes +men) in 2021. Its behavior has been part of phrase match since then, and you can no longer create new BMM keywords.
Phrase Match (""):
Keyword: "men's running shoes"
Triggers: "nike men's running shoes", "men's running shoes cheap"
Doesn't trigger: "men's trainers"
→ High control
Exact Match ([]):
Keyword: [men's running shoes]
Triggers: only "men's running shoes" (+ close variants)
→ Highest control
→ Highest CTR (relevance!)
→ Best QS
Recommendation for high QS (starting point from my practice):
80% budget: Phrase + Exact Match (high control = high CTR = high QS)
20% budget: Broad Match only with Smart Bidding and clean negative keywords (discovery, find new keywords)
Strategy 10: Optimize Account Structure
Problem: Chaotic structure = poor relevance
❌ Poor structure:
Campaign: "All Products"
  Ad Group: "Shoes"
    Keywords: running shoes, sneakers, boots, sandals, ... (100 keywords)
    Ads: Generic shoe ads
→ Low relevance = QS 4-5
✅ Good structure:
Campaign: "Running Shoes"
  Ad Group: "Nike Men's Running Shoes"
    Keywords:
      - [nike men's running shoes]
      - "nike men's running shoes"
    Ads: Nike men's running shoe ads
    Landing Page: /nike-running-shoes-men

  Ad Group: "Nike Women's Running Shoes"
    Keywords: [nike women's running shoes]
    Ads: Nike women's running shoe ads
    Landing Page: /nike-running-shoes-women
→ High relevance = QS 8-9
Structure principles:
- Granularity: Specific ad groups
- Thematic grouping: Similar keywords together
- Max. 10-20 keywords per ad group
- At least 2 responsive search ads per ad group with "Good" or better Ad Strength (Google recommendation)
- Dedicated landing pages
Strategy 11: Optimize Ad Rotation
Problem: Poor ads keep running = QS drops
Ad rotation settings:
Campaign → Settings → Ad Rotation

Option 1: "Optimize" (recommended)
→ Google shows better ads more frequently
→ Higher average CTR = higher QS

Option 2: "Don't optimize: Rotate evenly"
→ A/B testing (but: worse ads lower average QS!)
Best practice:
Phase 1 (first 2-4 weeks): "Rotate evenly"
→ A/B testing, collect data

Phase 2 (after 4 weeks): Switch to "Optimize"
→ Pause worse ads (don't delete!)
→ Only best ads run = highest CTR = highest QS
Strategy 12: Improve Conversion Rate
Important first: Conversion rate is not a QS component. Google does recommend it as a proxy, though: it doesn't impact your landing page status, but it is a good way to measure and optimize the landing page. What makes a page better for visitors (relevance, clarity, speed) tends to help both in my experience.
CR optimizations:
1. Landing page CRO:
- Clear headlines
- Strong CTAs (large, high contrast)
- Trust elements (reviews, certificates)
- Simple forms (max. 5 fields)
- Fast load time (<2 sec)
2. Maximize relevance:
Ad promises "20% discount"
→ Landing page MUST show 20% discount!
Otherwise: The page doesn't deliver what the ad promised
3. Mobile optimization:
- Touch-friendly (large buttons)
- Click-to-call
- Minimized forms
Connection (simplified):
Poor LP:
→ Visitors don't find what the ad promised
→ weak landing page experience + low conversion rate

Good LP:
→ Content matches the search, loads fast, clear next step
→ better landing page experience + higher conversion rate
QS Improvement Timeline
Reality: QS doesn't change overnight!
Typical course from my practice, not a promise (the numbers are an example):
Week 1-2:
- Implement changes (better ads, LP optimization, etc.)
- No QS increase visible yet (Google needs data!)
Week 3-4:
- First QS improvements (5/10 → 6/10)
- CTR increases (2% → 3%)
Month 2-3:
- Significant improvement (6/10 → 8/10)
- CPCs drop (€2 → €1.40)
Month 3-6:
- Stabilization at high level (8-9/10)
- CPCs in the example noticeably lower than at the start
Important: Patience! QS needs time + data.
Quality Score Myths
Myth 1: "QS is directly manipulable"
❌ False: You can't directly set QS ✅ True: You can optimize the 3 components (CTR, relevance, LP)
Myth 2: "CTR doesn't matter, only conversions count"
❌ False: Expected CTR is one of the three QS components, so it matters a lot ✅ True: High CTR = high QS, and according to Google the better ad quality behind it can often lead to lower CPCs, so more conversions with the same budget
Myth 3: "Deleting resets QS"
❌ False: According to Google, QS is based on past impressions for exact searches of your keyword, and Google does not document a reset from deleting and re-adding ✅ True: Pausing is still usually the better choice, because the statistics stay on the element and you can reactivate at any time
Myth 4: "QS 10/10 is the goal"
❌ False: QS 10/10 very difficult + not always necessary ✅ True: QS 7-9 is excellent (diminishing returns after 8)
Myth 5: "Account-level QS exists"
❌ False: No global account QS ✅ True: QS is per keyword (also for historical domain, but mainly keyword-level)
Tools for QS Optimization
Analysis:
- Google Ads Quality Score Columns (built-in, free)
- Optmyzr Quality Score Tracker (from €99/month)
Landing page speed:
- Google PageSpeed Insights (free)
- GTmetrix (free)
- WebPageTest (free)
Mobile testing:
- Lighthouse in Chrome DevTools (free, Google retired its Mobile-Friendly Test in December 2023)
- Responsive Design Checker (free)
Keyword research:
- Google Keyword Planner (free)
- SEMrush (from €119.95/month)
- Ahrefs (from $99/month)
Conclusion
From my practice, better ad quality is the cheapest way to lower CPCs, and Quality Score shows you where to start.
Priorities:
Week 1 (quick wins):
- Include keywords in ads (better relevance)
- Add negative keywords (higher CTR)
- Check landing page speed (<2 sec!)
Week 2-4 (structure):
- Structure campaigns/ad groups more granularly
- Create tightly themed ad groups for top keywords
- Make landing pages more dedicated
Month 2-3 (optimization):
- A/B test ads (increase CTR)
- Optimize mobile landing pages
- Improve conversion rate
Realistic expectation: A higher QS builds up over weeks to months. How much your CPCs drop as a result depends on competition and your starting point, and nobody can honestly promise you fixed percentages.
FAQ: Google Ads Quality Score
What is the Google Ads Quality Score?
Quality Score (QS) = Google's rating of your keywords, ads, and landing pages' relevance on scale 1-10. 3 components: 1) Expected CTR, 2) Ad Relevance, 3) Landing Page Experience (Google does not publish an official weighting). Important because: according to Google, the high ad quality that QS reflects can often lead to lower CPCs and better positions. In the fictional worked example you pay significantly less per click at QS 9/10 than at QS 5/10. Google says QS itself is not an input in the auction but a diagnostic tool. The ad quality it reflects does feed into Ad Rank alongside your bid, the auction context and other factors, so a better ad can win against a higher bid.
How can I quickly improve my Quality Score?
3 quick wins: 1) Include keywords in ads (min. 2x - headline + description) → better ad relevance. 2) Use negative keywords aggressively (avoid irrelevant clicks) → higher CTR. 3) Optimize landing page speed to <2 sec (compress images, CDN, caching) → better LP experience. More: Dedicated landing pages per ad group, tighter match types (Phrase/Exact instead of Broad), add assets (formerly ad extensions). Important: in my experience QS needs 3-4 weeks for visible changes!
Why is my Quality Score low (3-4)?
5 main reasons: 1) Low CTR (ads not relevant/attractive enough). 2) Keyword not in ad (poor ad relevance). 3) Broad Match + no negative keywords = many irrelevant clicks. 4) Generic landing page (homepage instead of dedicated LP). 5) Slow landing page (>3 sec load time). Check: Google Ads → Keywords → Columns: Quality Score components shows exactly WHICH component is below average (CTR, ad relevance, LP experience).
How long does it take to improve Quality Score?
Typical course from my practice, not a promise: Week 1-2: Implement changes, no visible QS increase yet (Google needs data). Week 3-4: First improvements (often +1-2 points). Month 2-3: Often a clear improvement, how far it goes depends on your starting point. Important: Patience! QS doesn't change overnight. Google needs enough impressions per keyword before it shows a QS at all (until then the column shows no value). Faster improvement with: High-volume keywords (more data), large changes (completely new LP vs. small tweaks).
What's more important: CTR or conversion rate for Quality Score?
CTR is the more direct lever! Expected CTR is one of the three QS components (Google does not publish an official weighting). Conversion rate is not a QS component: according to Google it doesn't impact your landing page status, but it works well as a proxy to measure and improve the landing page. Strategy: 1) Primarily optimize CTR (better ads, higher relevance, assets), 2) Secondarily optimize CR (better landing page). Mistake: Focus on CR, ignore CTR → QS stays low despite good conversions. Correct: Both important, but CTR = more direct QS lever.
Should I pause keywords with low QS?
Depends! Pause when: QS 1-3 + high CPCs + unprofitable → YES, pause (wasting money). Don't pause when: QS 4-5, but profitable (despite high CPCs) → optimize instead of pause. Best practice: Pause keywords instead of deleting them (statistics stay on the element, you can reactivate any time), create parallel new ad group with: 1) tighter match types (Exact/Phrase), 2) better ads, 3) dedicated landing page. After a few weeks, in my experience QS is often clearly higher than before.
What are SKAGs and do they still help Quality Score?
SKAG = Single Keyword Ad Group = ad group with only 1 keyword, formerly set up in 3 match types (Exact, Phrase, Broad Modifier). The Broad Modifier has been gone since 2021, and the method is only of historical interest today: exact match also covers close variants, Smart Bidding and responsive search ads benefit from pooled data, and SKAGs tend to fragment the account. What remains is the idea behind them: instead of an ad group "Shoes" (50 keywords, generic ad), you build tightly themed ad groups with 3-5 closely related keywords, a matching ad and a dedicated landing page. In my experience that gets you the relevance without fragmenting the account.
How important is landing page speed for Quality Score?
Important! Google explicitly names faster loading as a way to a better "Landing Page Experience", one of the three QS components. On top of that, in my experience every extra second of load time tends to lower conversions noticeably, even though conversion rate itself does not feed into QS. Rule of thumb from my practice (Google does not publish fixed thresholds): <2 sec ✅, 2-3 sec 😐, >3 sec ❌. Check: Google PageSpeed Insights. Quick fixes: Compress images (TinyPNG), CDN (Cloudflare free), caching, minify CSS/JS. Goal: <2 sec, which in my experience also improves your LP experience.