
The monthly report is one of those tasks nobody likes but that still eats up time: copying numbers from several systems, pasting them into a document, commenting, sending. This is exactly where automation pays off, if you divide the work the right way.
In this article I describe how I build such a workflow. It takes a closer look at one of the workflows from AI Automation for SMEs: 4 Workflows Worth Building. For more on the metrics themselves, see Google Ads Reports & Analysis.
The principle: separate numbers from text
The most common mistake is to give a language model raw exports and hope that correct numbers and clever sentences come out. A clear separation works better:
- The workflow fetches and calculates the figures. Always the same sources, always the same formulas.
- The model only comments. It receives finished figures and describes what has changed. You do not let it calculate anything.
- You review and put it in context. What was the reason, and what does it mean for next month?
Step 1: Define the questions
Before you connect anything, write down which questions the report should answer. For example: how many inquiries came in, what did they cost, what changed compared with last month? A few metrics with a clear definition beat a dashboard with everything. Whoever reads it in the end wants an answer, not a flood of data.
Step 2: Clarify sources and definitions
Typical sources are Google Ads, GA4 and a list of the actual inquiries from email, phone or CRM. For each metric, decide where it comes from:
- Cost and clicks come from Google Ads.
- Visitors and behavior on the website come from GA4.
- Qualified inquiries and deals come from your own data, because only there can you see what actually happened.
Google Ads and GA4 each count conversions by their own logic. The difference is normal as long as you know why. How to link them cleanly is covered in Linking GA4 with Google Ads.
Step 3: Combine the data
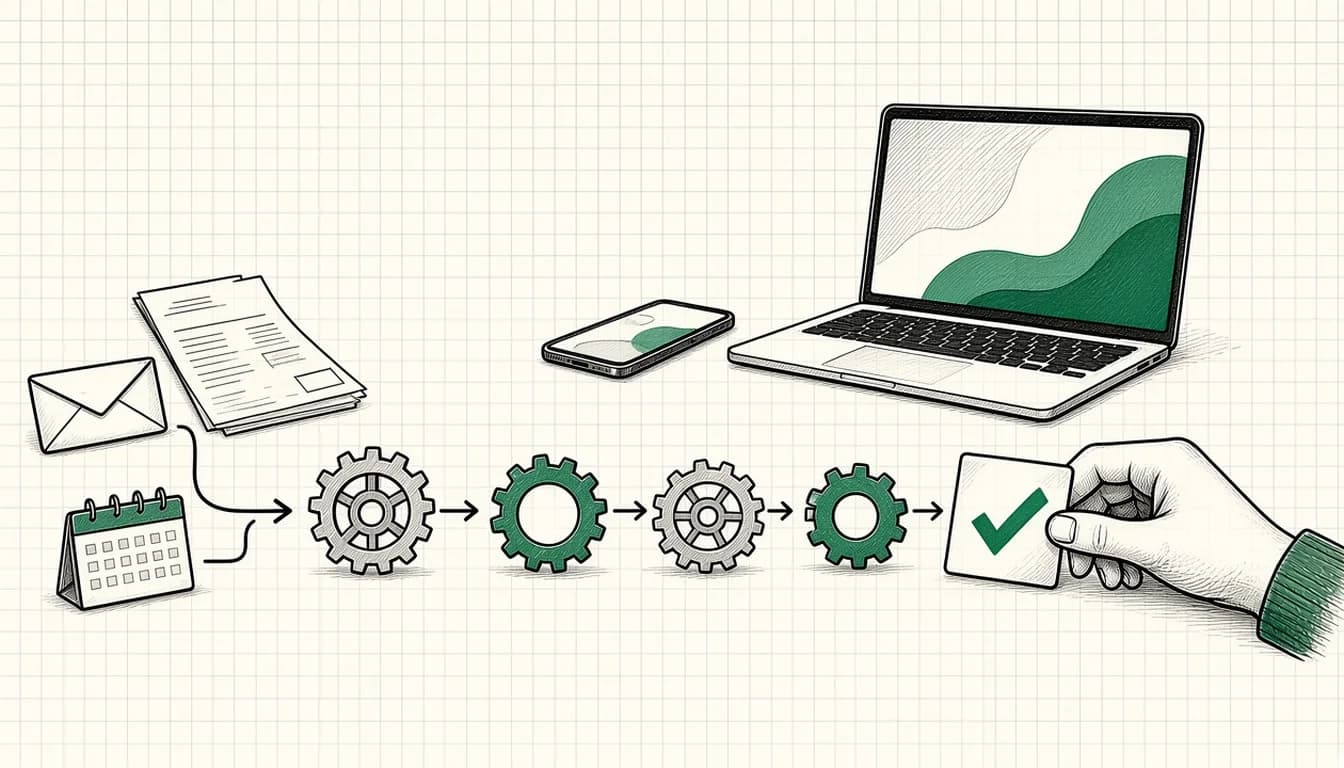
An automation platform such as Make can fetch the figures regularly and store them in a table, one row per period. This is the least spectacular step and the most valuable one, because afterwards everything comes from one source. Also plan for failure cases: what happens if a source does not respond? The workflow should then report that data is missing instead of building half a report.
Step 4: Let the model comment
From the table, the figures go to a model such as Claude, ChatGPT or Gemini together with the previous month's figures and, where useful, the same period last year. The instructions in the prompt matter more than the model:
- Use only the figures provided, invent nothing.
- Name changes, and label causes only as assumptions.
- Flag anything unclear as a question to you instead of smoothing it over.
- Fixed structure: overview, notable points, open questions.
The result is a draft, not a finished report.
Step 5: Review, put in context, send
Before anything goes out, you look at three things: do the figures match the account (spot check)? Are the stated changes plausible? Is anything missing that only you know, such as a promotion, a website change or an outage? Only then does the report go out. If the draft regularly needs no corrections, the review stays; it just gets shorter.
Typical pitfalls
- Too many metrics. The commentary becomes arbitrary when everything is included.
- No definition. If nobody knows what "inquiry" means, you compare apples with oranges.
- Trust without a spot check. A workflow can quietly deliver wrong numbers for months if nobody looks.
- Data protection last. Aggregated metrics are usually unproblematic. As soon as individuals can be identified, clarify first which data goes to external tools. This is general guidance, not legal advice.
If you do not want to build it yourself
How I set up such workflows for small businesses is described on the AI automation page. You can also start with a single report and expand afterwards.
As of: November 2026